Web Development Fundamentals: Console
Hola. ¿Qué onda? Today we are going to proceed with our series on the developer tools that are available in every major desktop web browser. Today we are going to take a gander at what we can call “the web console”.
First, what is console? A console, in developer terms, is some thing that displays information about a program as it is operating. The web console shows messages that are automatically produced by special commands that can be included in the website’s JavaScript code. This may include warnings, errors, or general messages that are triggered when certain routines are running. It is like listening to someone talking about what they are doing, and hollering if they run into trouble.
Of course you can access the web developer tools’ console on any website you want, but I’ll proceed here assuming you want to look at a website that is a part of our King Book web library. So before we go forward any further, please open a window on a desktop computer and go to the web library and go to the Games section to find the item named “Memory Moji”. Remember, you can read these instructions on your phone while you do web developer stuff on your desktop computer.
Or if you are already on your desktop and have two screens, just click here
The console can be accessed for each individual browsing tab by activating the developer tools for your browser. Remember, you can do this with the keyboard shortcut ctrl + shift + i or by going to your browser’s main menu and selecting the “Developer tools” option.
Your developer tools will probably open to the last tool that you used. If you have been following along with this series, it will open to the “Inspector” tab that we went over in the last article. Feel free to poke around the Inspector/Elements tab for this TV streaming website as you did before if you want to examine the HTML document for another website. When you are done, let’s move on to exploring the “Console” tab.
Time to explore the Console tool. Can you find the Console tool tab in your developer tools? It is one of the primary tool tabs, it should be sitting right next to the Inspector tab. On Firefox, it looks like this:
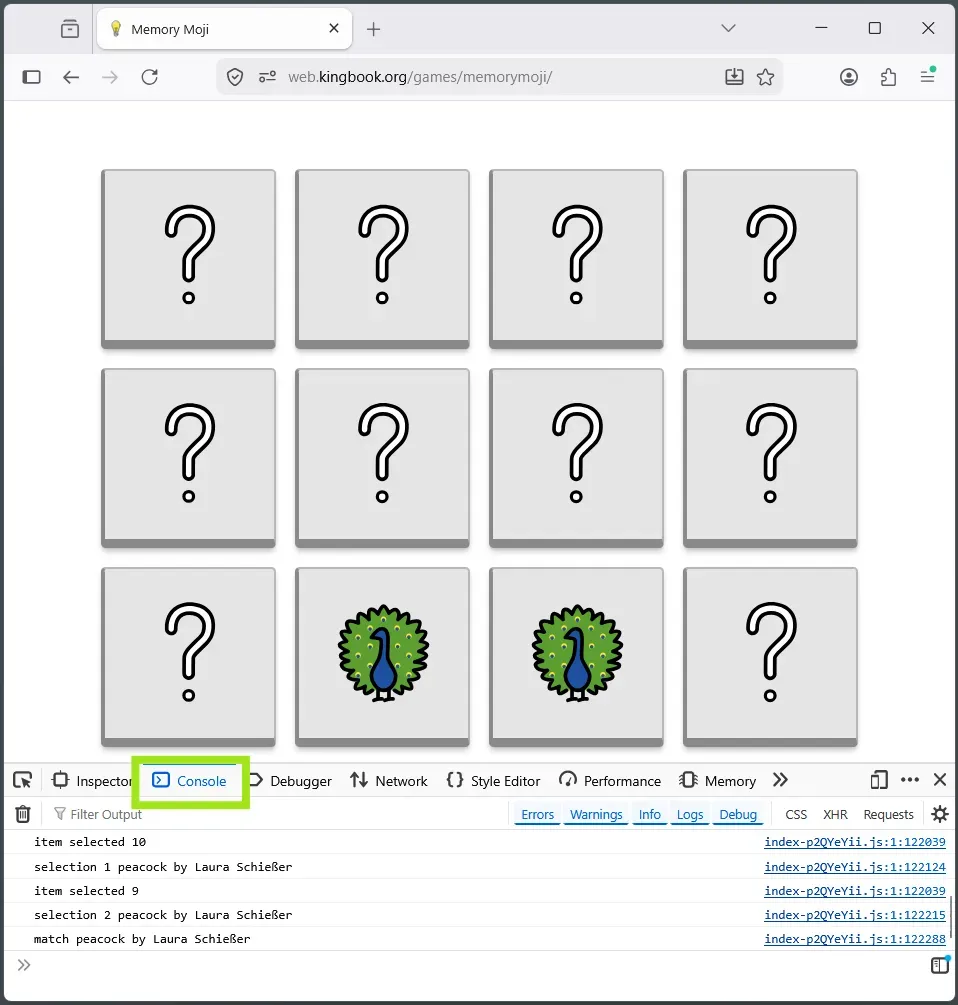
Once there, you’ll see the program’s output. This game website should just have what we call “Log” output. Log outputs are messages that the program’s programmer intentionally programmed into their web program, with JavaScript. We’ll learn how we do it in just a minute.
In general, the console can also display output from a number of categories: Errors, Warnings, Info, Logs, and Debug. You can find buttons to filter the output if you need to focus on just one category. It is usually the most helpful to keep all categories visible; you will likely only ever see output from Logs, Warnings, and Errors categories anyhow. Each of these are color-coded in the Console tool.
Error and Warning messages that may appear in the Console are usually produced automatically, usually not something most web developers need to worry about writing. The web developer’s main concern with these categories is if their web program triggers the appearance of errors or warning messages. Error messages can let us know if the program is broken in some way. Warnings are usually about performance issues or helpful reminders about following best practices. They are both mostly helpful for people who are building websites, but they can also be helpful for everyday users to gauge the current structural integrity of a website.
Let’s get back to thinking about the “Logs” category. This is the category of messages that (I hope) you will see across King Book websites. By the way, If you ever see the Error or Warning kind around here, please do let me know so I can fix it!
Log messages in the console are pretty fun to read and to write. They can give us a window into the different processes that are happening behind the scenes. I like to put a lot of log messages in some of the websites I make. I use them liberally as I’m writing the program, and then usually leave some in even after the program is stable. They can also be used to provide useful information to the advanced user.
Our memory game website doesn’t have an overwhelming amount of log output, so it is a good one to look at for this lesson. I have set it to produce information about the illustration’s artist and some other stuff every time you select a tile.
Before we go, let’s look at a quick example of how these logs are produced. Using JavaScript, we can have our websites produce log messages by using the log() method of the console interface. Like this:
<script>
    // print a single message to the console's log output
</script>
You can also execute JavaScript directly in the console window, such as this call to console.log. Just find the >> symbol at the bottom of the console and type your command there.
That’s all there is to writing log messages! I’m sure you can also easily guess or find out how to write the other console message categories if you ever needed to.
Alright well that’s all for this lesson. Today we’ve learned about the not-so-secret messages that web developers like to use, and that we can all read. We’ve discovered the purpose of the Console tool of your browser Developer Tools! We also all now know how to write these log messages ourselves. This is a very simple concept, but the console could certainly be one of the most-useful tools you have at hand as a web developer.
Ta-ta for now. In the next lesson in this series on the browser’s Developer Tools, we’ll learn about the amazingly informative “Network” tool. Stand by for transmission.
<3 Grant